Chapter 4 Filtering
Chapter keywords: filter, resonance, resonator, Helmholtz, frequency, frequency component, cutoff, slope, bandwidth, emphasis, pre-emphasis, de-emphasis, spectral envelope.
4.1 Introduction
A filter is a device that changes the spectrum of the input signal, by enhancing certain frequency components and/or by attenuating others. Filters play an important role in speech analysis. Filters can be of an acoustic nature (e.g. an organ pipe, or the human vocal tract) or they can work by electronic means. We already encountered filters as a routine component in (or just before) analog-to-digital conversion of a sound wave (§2.3.1) to prevent aliasing.
4.2 Types of filters
There are four different basic types of filters, differing in their frequency characteristics (specifying which frequency components are attenuated and which are enhanced).
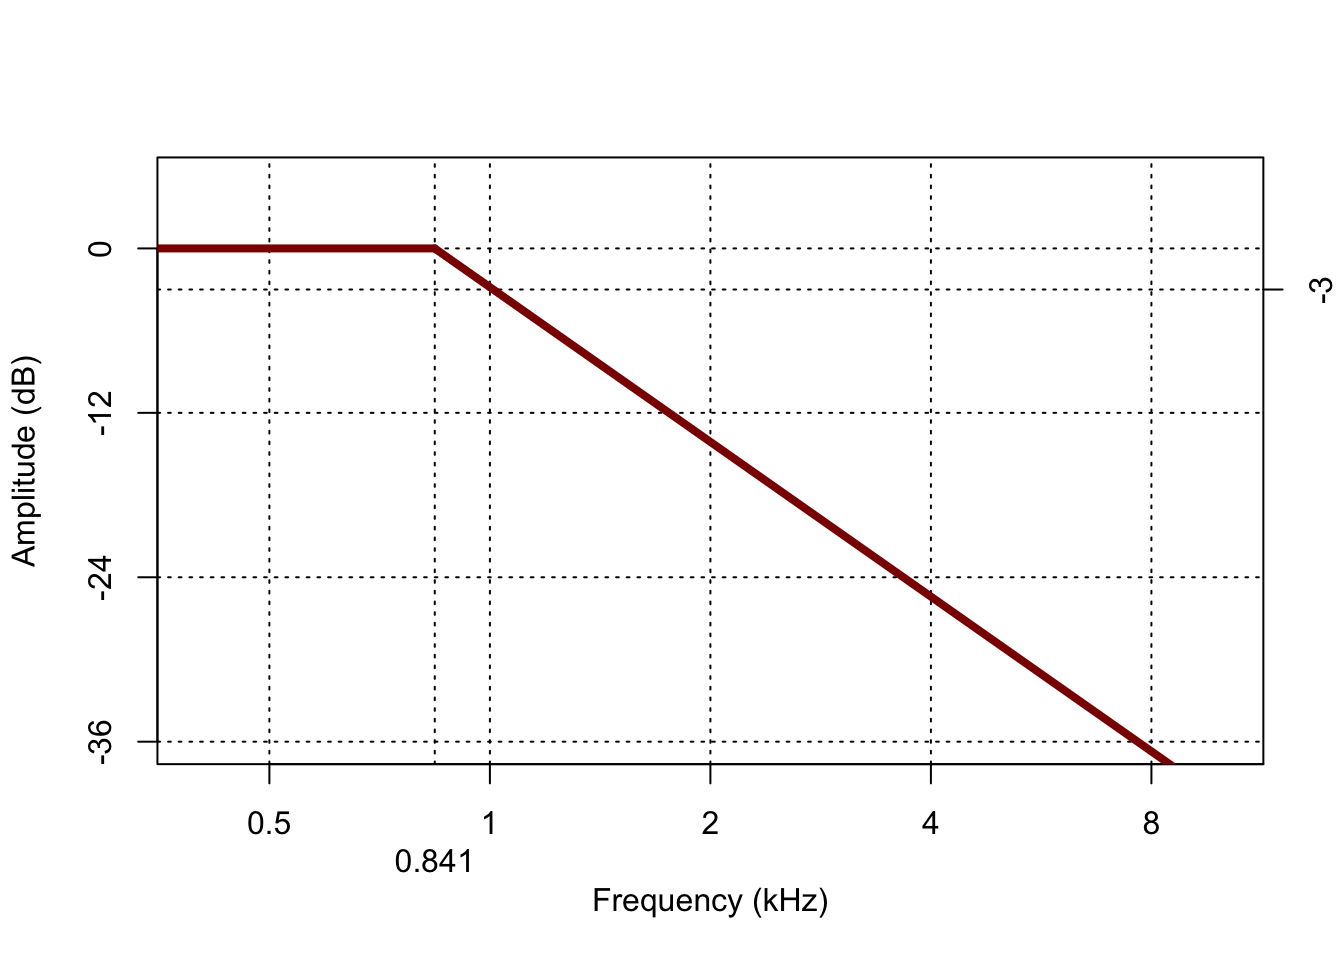
- Low-pass filters (Fig.4.1 allow lower frequencies to pass through, but higher frequencies are attenuated.

Figure 4.1: Frequency characteristic of a low-pass filter, with cutoff frequency 1000 Hz, and slope of -12 dB per octave.
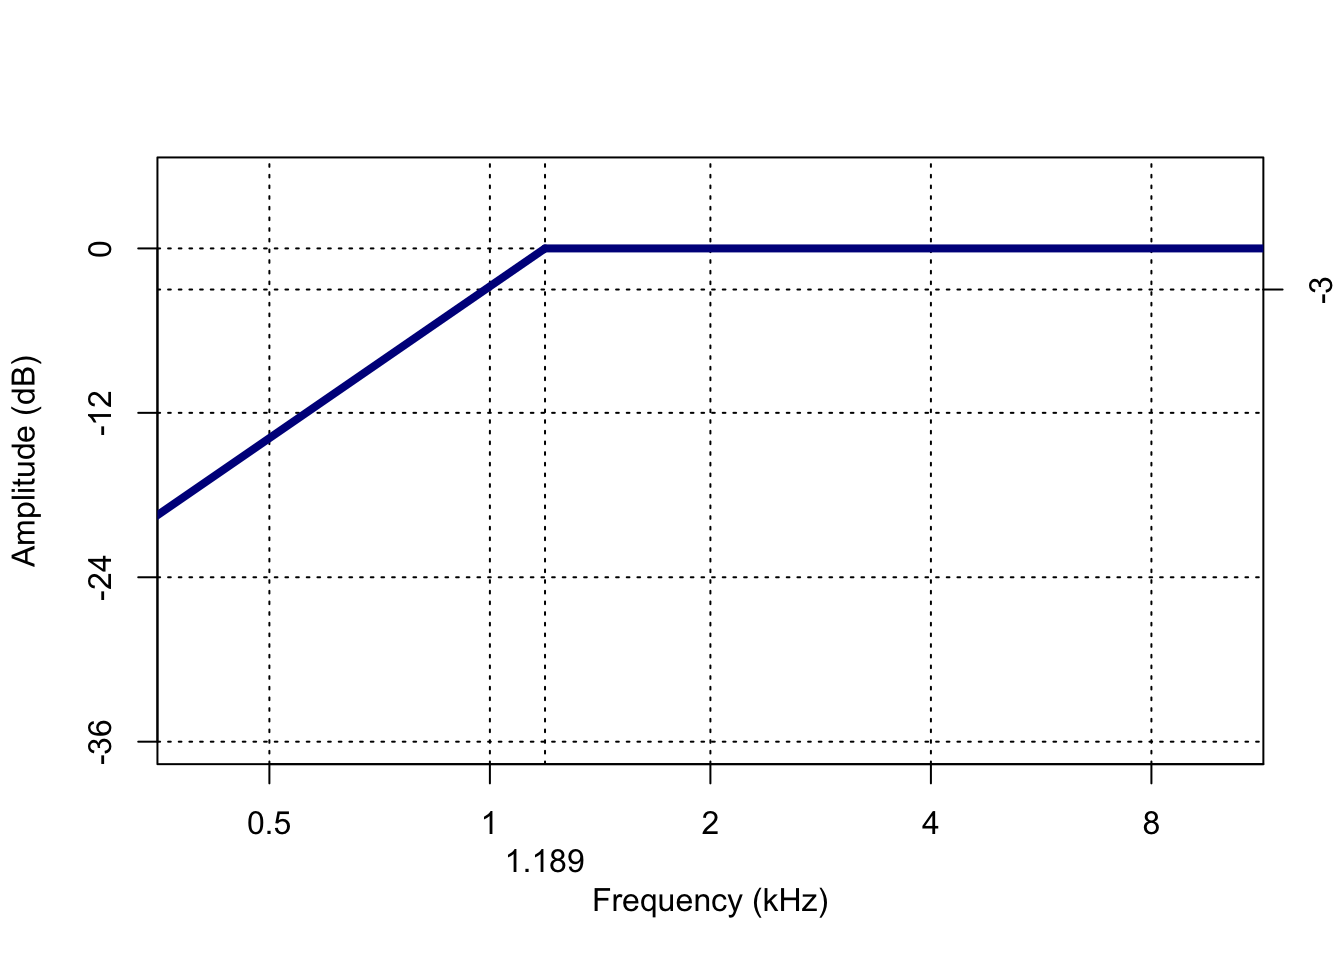
- high-pass filters (Fig.4.2) do the reverse: they allow higher frequencies to pass through, but lower frequencies are attenuated.

Figure 4.2: Frequency characteristic of a high-pass filter, with cutoff frequency 1000 Hz, and slope of -12 dB per octave.
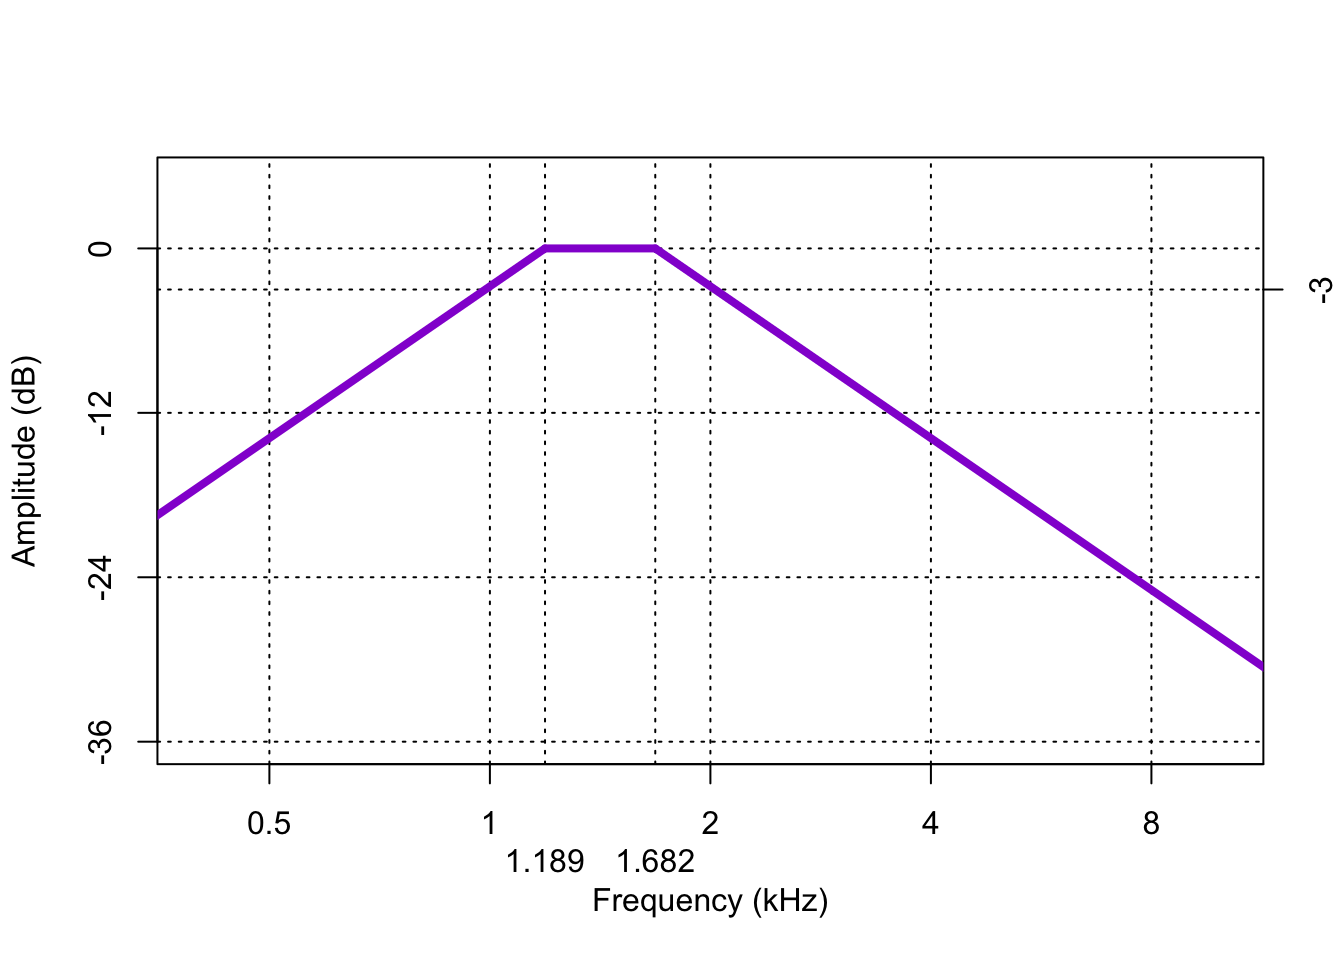
- band-pass filters (Fig.4.3) allow frequencies within a certain frequency band to pass through, and they attenuate frequencies outside this pass band.

Figure 4.3: Frequency characteristic of a band-pass filter, with a pass band from 1 to 2 kHz (one octave), and with slopes of -12 dB per octave on both sides.
– A tuneable band-pass filter is essential for producing a spectrogram.
TODO crossref spectrogram
– A telephone works as a bandpass filter with a fixed pass band of 300 to 3400 Hz.
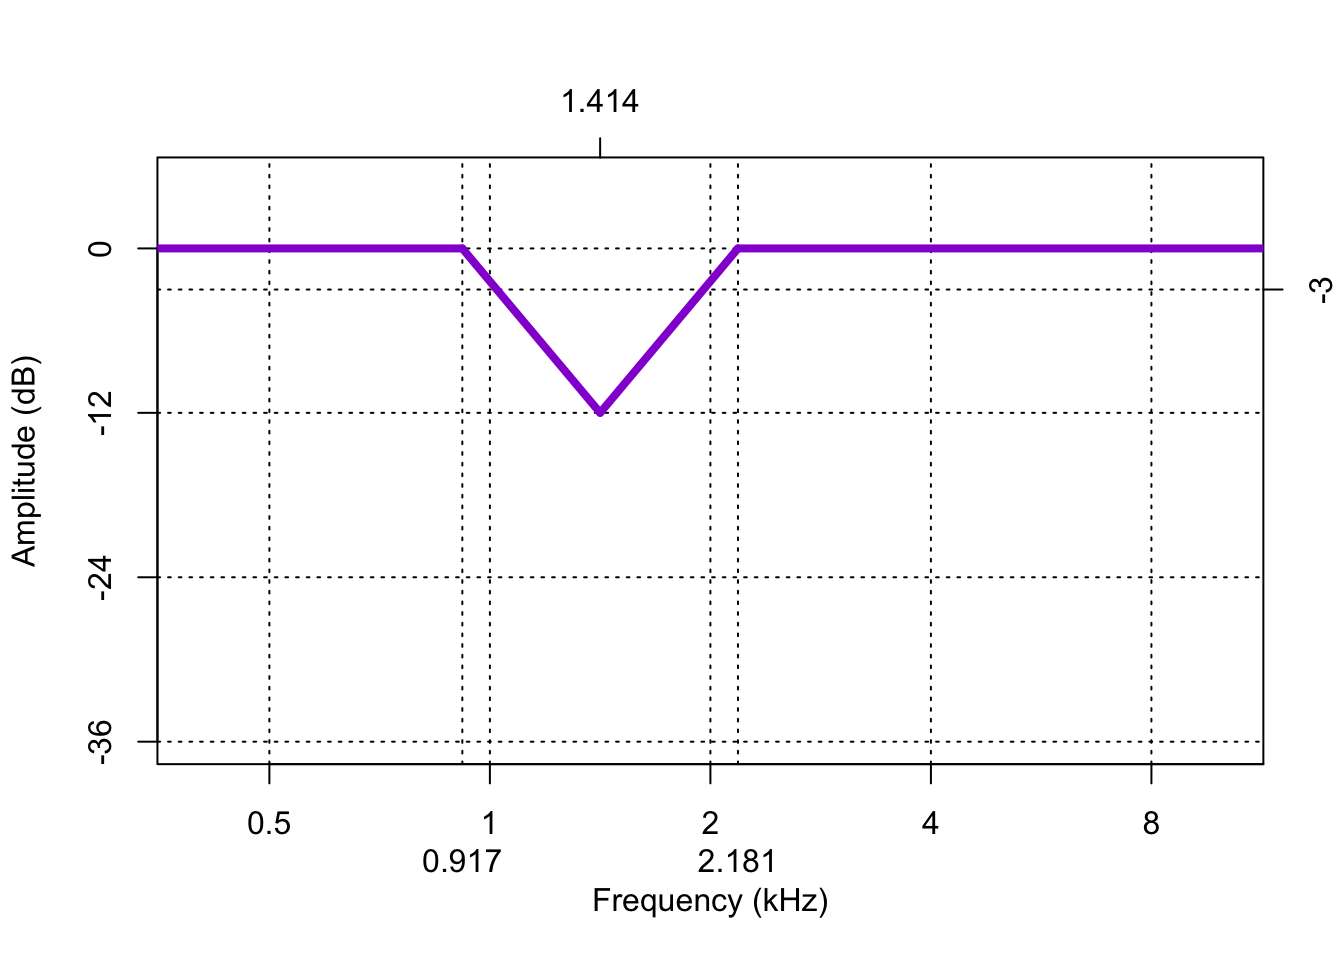
- band-reject or notch filters (Fig.4.4) again do the reverse: they attenuate frequencies within a certain frequency band, and allow frequencies outside this band to pass through.

Figure 4.4: Frequency characteristic of a band-reject filter, with a reject band from 1 to 2 kHz (one octave), and with slopes of -24 dB per octave on both sides.
4.3 Properties of filters
As shown in the figures above, a filter is characterised by two properties, viz. the cutoff frequency and the slope. Band-pass and band-reject filters are also characterised by their bandwidth.
4.3.1 Cutoff frequency
The cutoff frequency(ies) separates the pass band(s) and reject band(s) of the filter, that is, the frequency components that are attenuated and those that are passed through unattenuated. It is defined at the frequency where the attenuation is \(-3\) dB, as illustrated in the filter characteristics above.
4.3.2 Slope
The slope of the filter indicates the steepness of the attenuation between the pass band(s) and reject band(s). It is commonly expressed in dB attenuation per octave change in frequency (§1.8.1.1), that is, in dB per octave27.
4.3.3 Bandwidth
Band pass filters and band reject filters are also characterised by their bandwidth: the width of the frequency span affected by the filter, equal to the distance between the two cutoff frequencies of such filters.
This distance may be expressed as the musical interval between the lower and higher cutoff frequencies. Both filters shown in Figures 4.3 and 4.4 are so-called “octave band” filters, because the cutoff frequencies are one octave apart (§1.8.1.1) with a frequency ratio of 1:2.
In a musical third interval, the frequencies have a ratio of 4:5; filters with these cutoff frequency ratios are so-called “third band” filters. Both octave-band and third-band filters are widely used in phonetic research.
4.4 Emphasis filters
For reasons that we will see later (in §5.3.1), the spectrum of speech has a typical overall spectral slope of \(-6\) dB per octave (in its voiced parts). This downward overall slope was also visible in the spectral slice in Fig.3.3. Thus, the amplitude of higher frequency components decreases by about \(-6\) dB on average for each doubling of the frequency (§1.8.1.1). Consequently, spectral details of higher-frequency components tend to be poorly visible in the analysis. As a remedy, we can apply a so-called pre-emphasis filter, which modifies the overall spectral slope by \(+6\) dB per octave. This boosting of higher-frequency components ideally results in a flat spectral envelope of speech28, with equal amplitudes for all frequency components in speech. This makes the spectral details of speech equally discernible across the full spectral range.
The reverse operation is called de-emphasis filtering: this changes the overall spectral slope by \(-6\) dB/octave. This de-emphasis filtering was applied, for example, to obtain the brown noise (\(-6\) dB/oct) from the white noise (\(0\) dB/oct) in Fig.3.4.
4.4.1 How to apply a (pre|de)emphasis filter
Select an input Sound object in the
PraatObjects window. Then chooseFilter > Filter (pre-emphasis)...for pre-emphasis filtering, or chooseFilter > Filter (de-emphasis)...for de-emphasis filtering. The filter only applies above a certain cutoff frequency, to be specified. Choose a cutoff frequency below the lowest speech frequency, e.g. 60 Hz.The resulting filtered output Sound object is again added at the bottom of the list of objects.