Chapter 3 Complex sounds and spectra
Chapter keywords: sinewave sound, complex sound, spectrum, fourier transform, fourier analysis, fast fourier transform, FFT, harmonics, fundamental, fundamental frequency, f0, pitch, overtone, component, timbre, octave, noise, white noise, brown noise, impulse.
3.1 Introduction
The sine wave, depicted in Fig. 1.2, is the simplest sound possible. It is composed of the simplest back-and-forth variation or oscillation in air pressure, similar to the regular swing pattern or oscillation of a pendulum23. We only encounter sine wave sounds if they are artificially generated, and hardly ever in nature – although the sound of a tuning fork comes quite close to a sinewave pattern.
By contrast, complex sounds have more complex wave patterns. All natural periodic sounds are complex sounds. A complex sound can be regarded as the sum of multiple sine wave sounds. This relation has been described by the French mathematician, baron J.B.J. Fourier (1768–1830). The sine waves are termed ‘frequency components’ of the complex sound. Each of these components has its own frequency, amplitude, and phase. In a so-called ‘Fourier analysis’ or ‘Fourier Transform’ of a complex sound, these frequency components are being estimated from the waveform.
If the complex sound has a repeating waveform, then we have a periodic complex sound, of which Figure 3.1 provides an example. The resulting sound has been obtained by adding three frequency components, drawn in dotted lines, of 100 Hz (\(T=.01\)) and 200 Hz (\(T=.005\)) and 400 Hz (\(T=.0025\)), respectively. Note that the frequency with which the complex sound repeats itself, 100 Hz, is the same as that of the lowest component. This lowest component is called the fundamental, and its frequency is called the fundamental frequency (symbol \(f_0\)) of the complex periodic sound; we hear this \(f_0\) as its pitch. The higher components are called overtones. The fundamental and overtones are collectively called harmonics: the fundamental is the first harmonic, the first overtone is the second harmonic, etc. In a periodic complex sound, the frequencies of the overtones are integer multiples of the fundamental.
TODO crossref pitch, missing fundamental
Typical examples of periodic complex sounds are the vowel sounds in normal speech. The properties of a periodic complex sound depend on the amplitudes, frequencies and phases of its component harmonics.
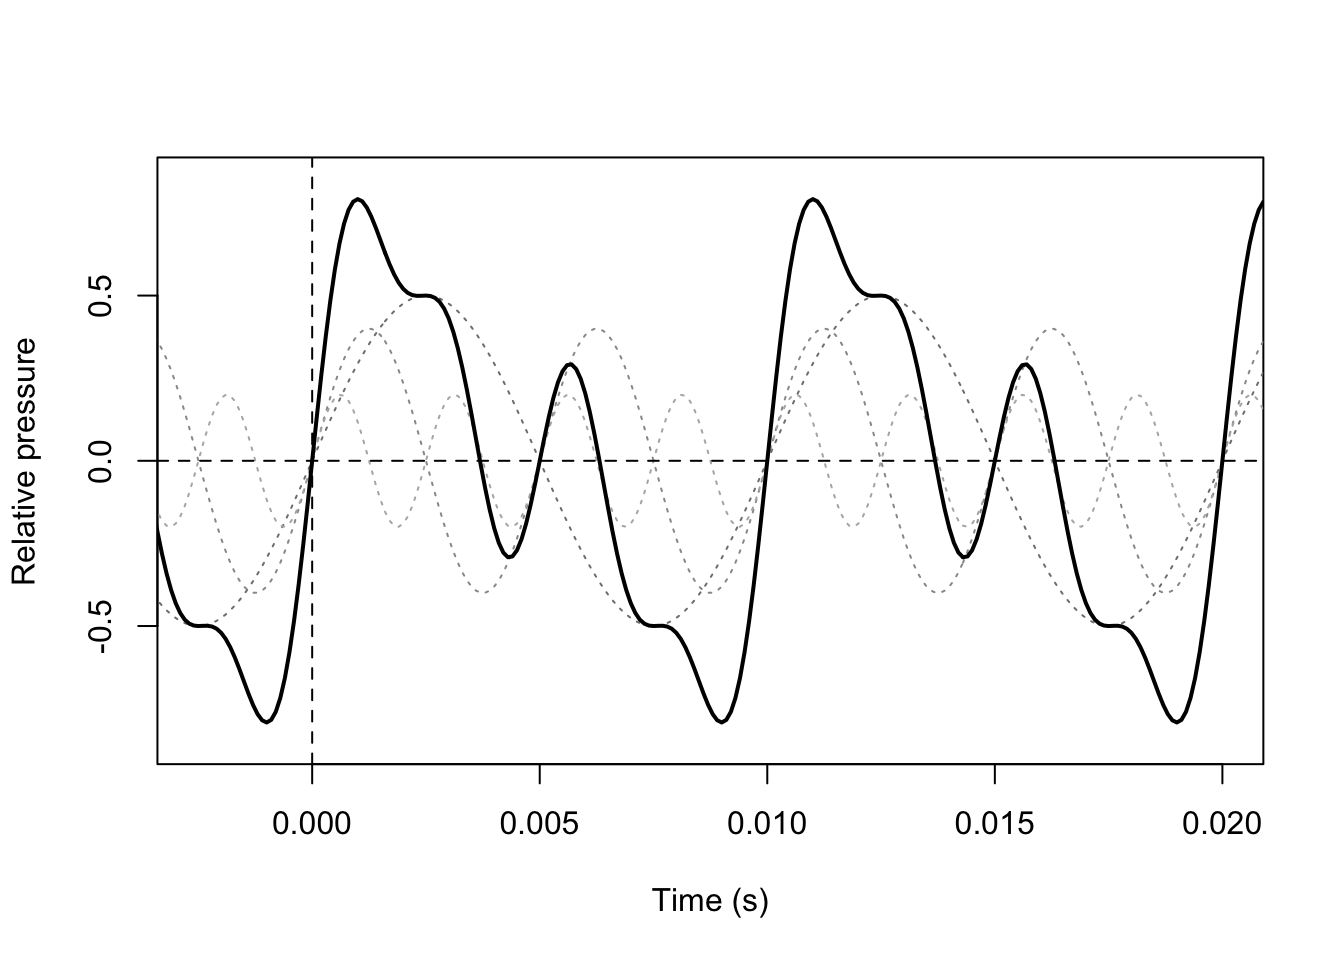
Figure 3.1: Oscillograms of three sinewave sounds and their resulting complex periodic sound.
3.1.1 Timbre
Two periodic complex sounds, having the same overall amplitude and fundamental frequency, may differ strongly in their character. The general name for this property is timbre. Timbre depends on the relative amplitudes of the harmonics, and hence very many different timbres are possible. For aperiodic sounds, timbre also depends on the relative amplitudes of the (infinitely many) frequency components. A sound may have a dull or sharp timbre, or rich or thin, warm or metallic. The difference between distinct vowels, such as /a/ vs. /i/, spoken by the same person at the same pitch and amplitude, is also a matter of timbre, as is the difference between similar but distinct consonant sounds, such as /s/ vs. /ʃ/.
Timbre is not a one-dimensional property of a sound (as frequency and amplitude are), but a multi-dimensional property.
3.2 Spectrum
A sound can be represented in two equivalent ways: as a function of time (in an oscillogram), or as a function of frequency. The latter representation is called a spectrum. A spectrum is useful to assess the frequency components of a signal, which are far easier to determine in a spectrum than in an oscillogram. A rainbow reveals the spectum of sunlight: water droplets refract the incoming light into its frequency components (colors). Similarly, complex sounds may be broken down into their (high and/or low) frequency components.
Figure 3.2 shows an oscillogram on the left (of the same complex sound as shown in Fig. 3.1), and its matching spectrum on the right. The spectrum shows the amplitude along the vertical axis, of each frequency component along the horizontal axis. (The phases of the frequency components are ignored.) Thus, a spectrum shows the frequency and amplitude of each component.
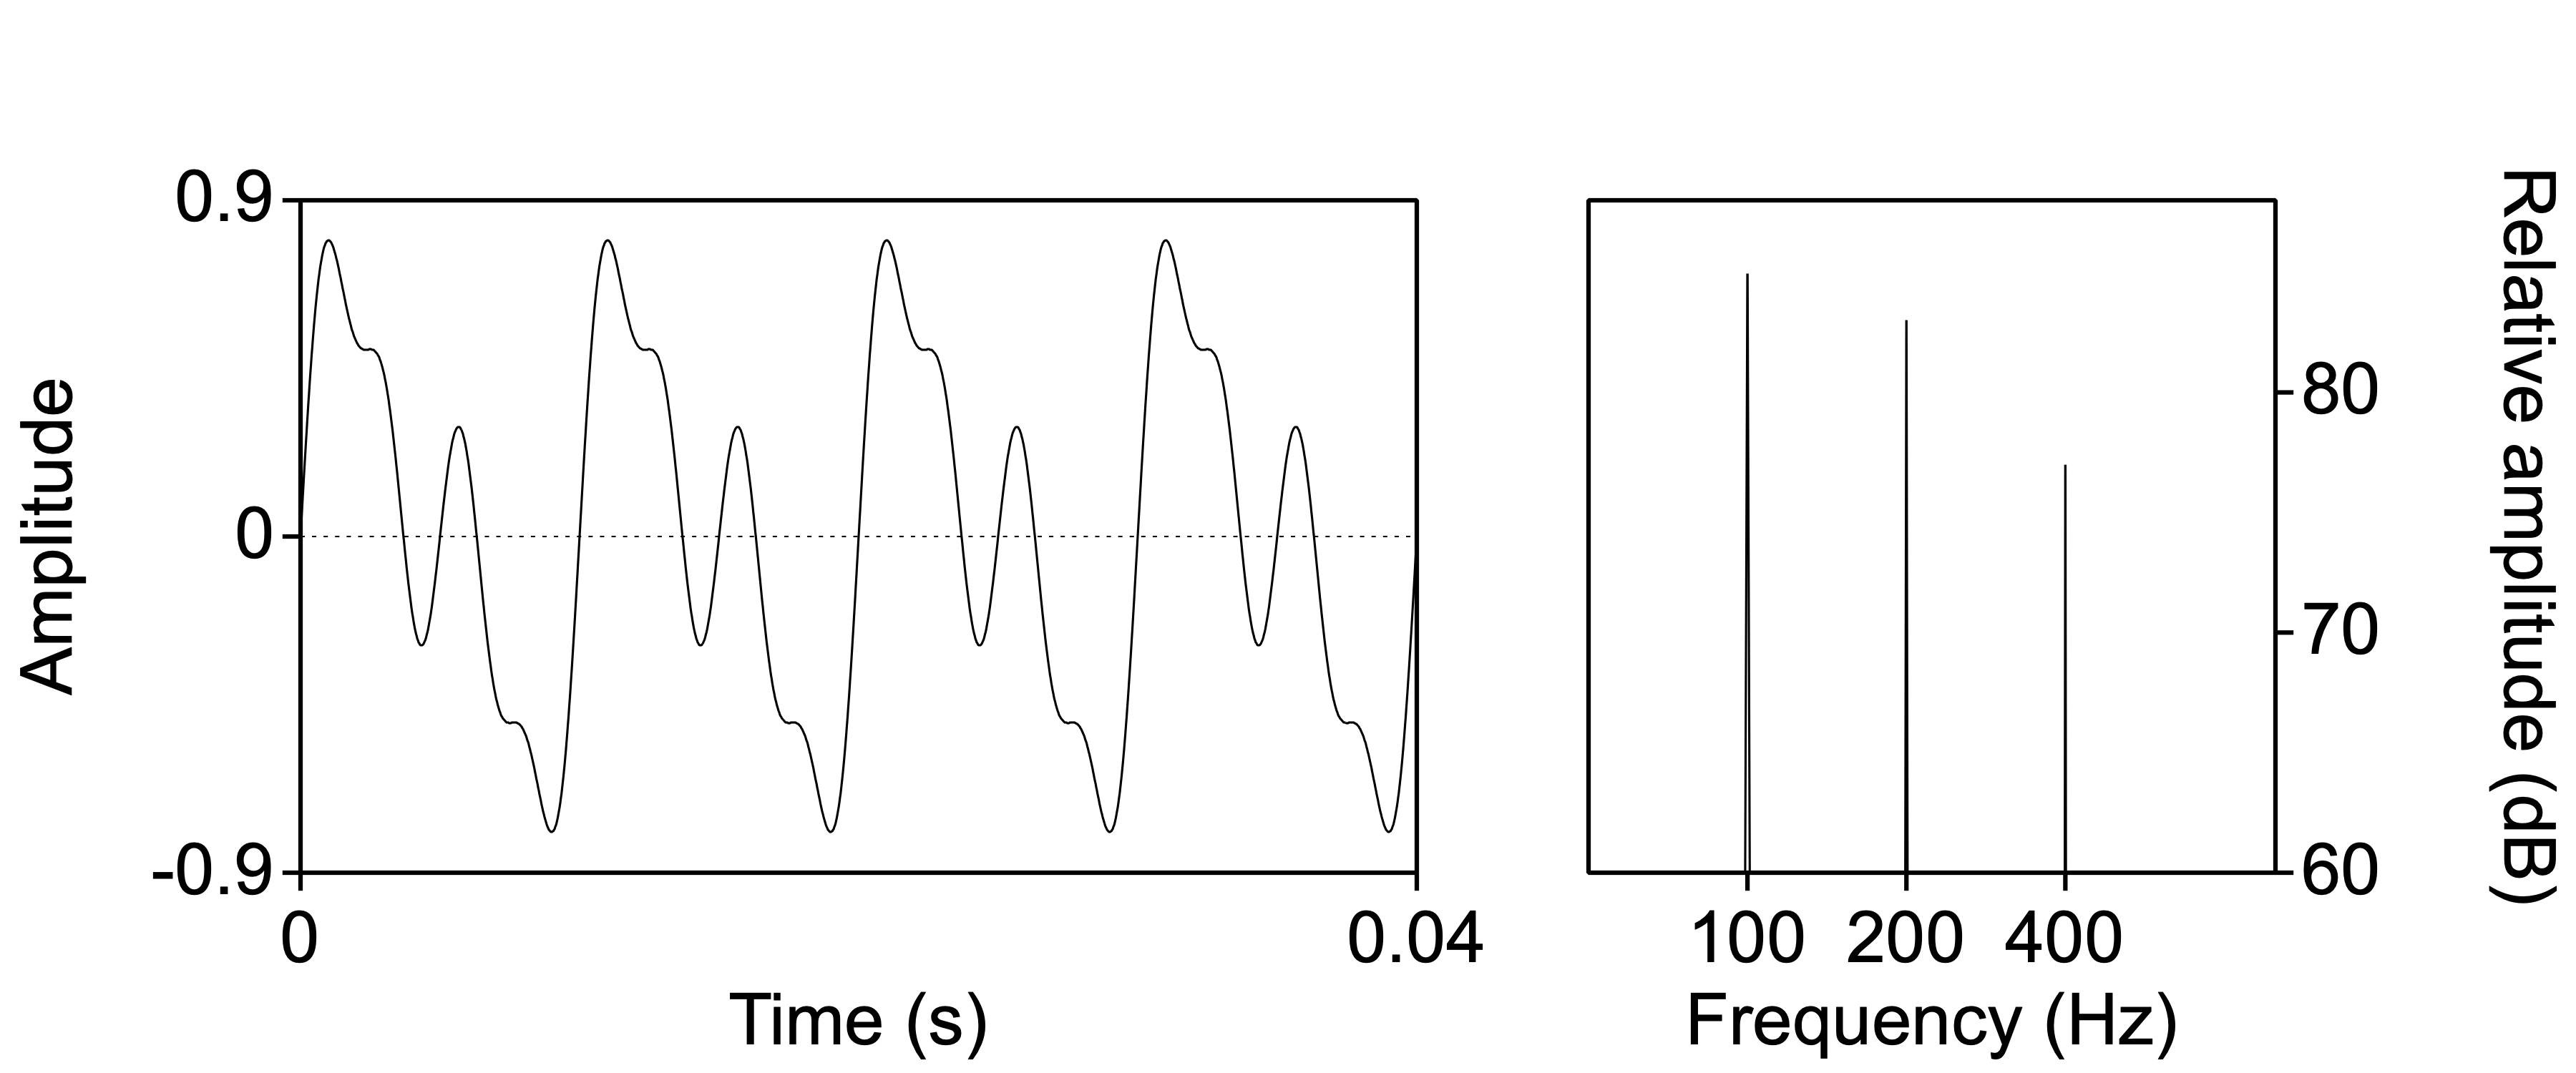
Figure 3.2: Oscillogram (left) and spectrum (right) of a complex periodic sound.
3.2.1 How to obtain a spectrum
In the
Praatobject window, select a Sound object.Next, in the
Praatobject window, chooseAnalyse spectrum >and thenTo Spectrum....Praatoffers two versions, regular and fast, of the Fourier analysis to estimate a spectrum. The faster version of the Fourier transform is termed ‘Fast Fourier Transform’ or FFT, and it requires significantly fewer computations. FFT requires that the number of samples to be analysed is a power of \(2\). If you choose theFastversion by ticking the box, thenPraatadds zeroes to your sound in order to meet this requirement.The result is a Spectrum object calculated over the entire Sound (plus additional zeroes, in FFT), and this Spectrum object is added at the bottom of the list of objects.
Remember to
Savethis Spectrum object if you wish.As the spectral representation (spectrum, horizontal axis is frequency) is equivalent with the temporal representation (oscillogram, horizontal axis is time), the Spectrum object may be reconverted again into Sound, by means of “inverse fourier transform”. To do so, select the Spectrum object, select button
Sound >and thenTo Sound.
3.2.2 How to obtain a spectral ‘slice’
Only rarely are we interested in the spectrum of an entire Sound object. Typically, we want to inspect the spectrum of the sound only over a small time window within that sound. For example, we might want to inspect the spectrum of the /i/ vowel sound in Figure 1.1, at \(t \approx 0.210\) seconds.
This can be done by means of two features in Praat which we will explore in depth only later, viz. the SoundEditor and the Spectrogram (Ch.6).
In the
Praatobject window, select a Sound object.Next, in the
Praatobject window, chooseView & Edit. This will open a so-called SoundEditor window, with the oscillogram as its main feature. For more details and instructions about the SoundEditor, see §2.7.2 and Appendix B.In the SoundEditor window, go to
Spectrogram...and thenSpectrogram settings. Here we may need to adjust the setting forWindow length.Praatwill average the resulting spectrum over the time window of \(2\times\) this value, centered around the position of the cursor in the oscillogram (see §6.4).
A short window (e.g. 0.005 s) will show more detail in the time domain (showing individual periods and transient sounds), but the resulting spectrum will be smeared in the frequency domain (so that individual harmonics are invisible). A long window (e.g. 0.015 s) will show less detail in the time domain (so that individual periods and clicks will be smeared in the time domain), but more detail in the frequency domain (so that individual harmonics may be visible). Read §6.4, read thePraatHelp information available in the menu window, then try various window lengths, and notice the differences in the subsequent spectral slices.In the SoundEditor window, go to
Spectrogram...and then chooseView spectral slice. As a first result, a new Spectrum object is added in the Objects window. The spectrum in this object is estimated over the window length on either side of the cursor position. Secondly, this new Spectrum object is opened in a SpectrumEditor window, see Fig.3.3 for an example.In the SpectrumEditor window, if you click inside the spectrum, the frequency and amplitude coordinates are shown. Placing the cursor on a spectral peak in the SpectrumEditor can be done by means of the button
Spectrumin the top row, then chooseMove cursor to nearest peak.
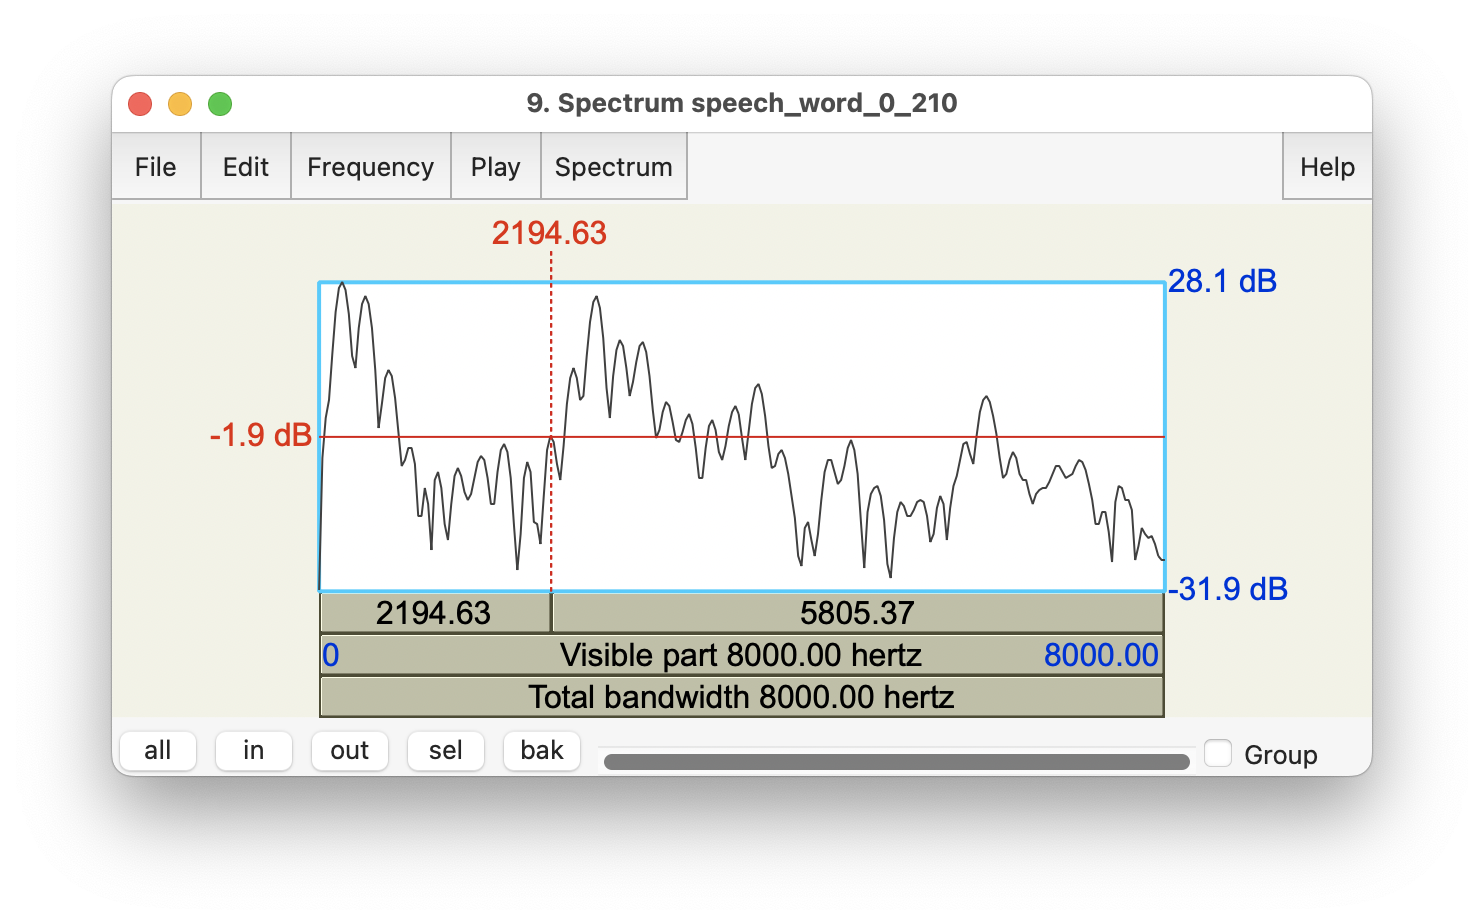
Figure 3.3: Spectral slice of the /i/ vowel in the word speech, estimated over 0.015 s on either side of the cursor at t=0.210 s.
3.3 Spectra of aperiodic sounds
Stable noise and brief impulses are two types of aperiodic signals (§1.7): the variations in air pressure do not follow a regular periodic pattern24. Aperiodic sounds do not have a fundamental frequency (because there is no regular period), and their phase is undefined, but aperiodic sounds do have an amplitude and a spectral composition.
3.3.1 Noise
First we discuss stable aperiodic sounds: noise. You might say that a noisy sound has an infinite number of frequency components. That is, the components are not only harmonics of the fundamental frequency (as with periodic complex sounds), but may be found at every frequency. The relative amplitudes of the many frequency components determines the timbre of the noise.
In white noise, all frequency components are equally strong25, and thus the spectral envelope is flat. In so-called brown noise, the spectral envelope decreases by \(-6\) dB per octave, so that lower frequencies are more dominant than higher frequencies. Because this spectral envelope resembles that of speech (cf. §5.3.1), brown noise is often used in phonetic research whenever we need to mask speech.
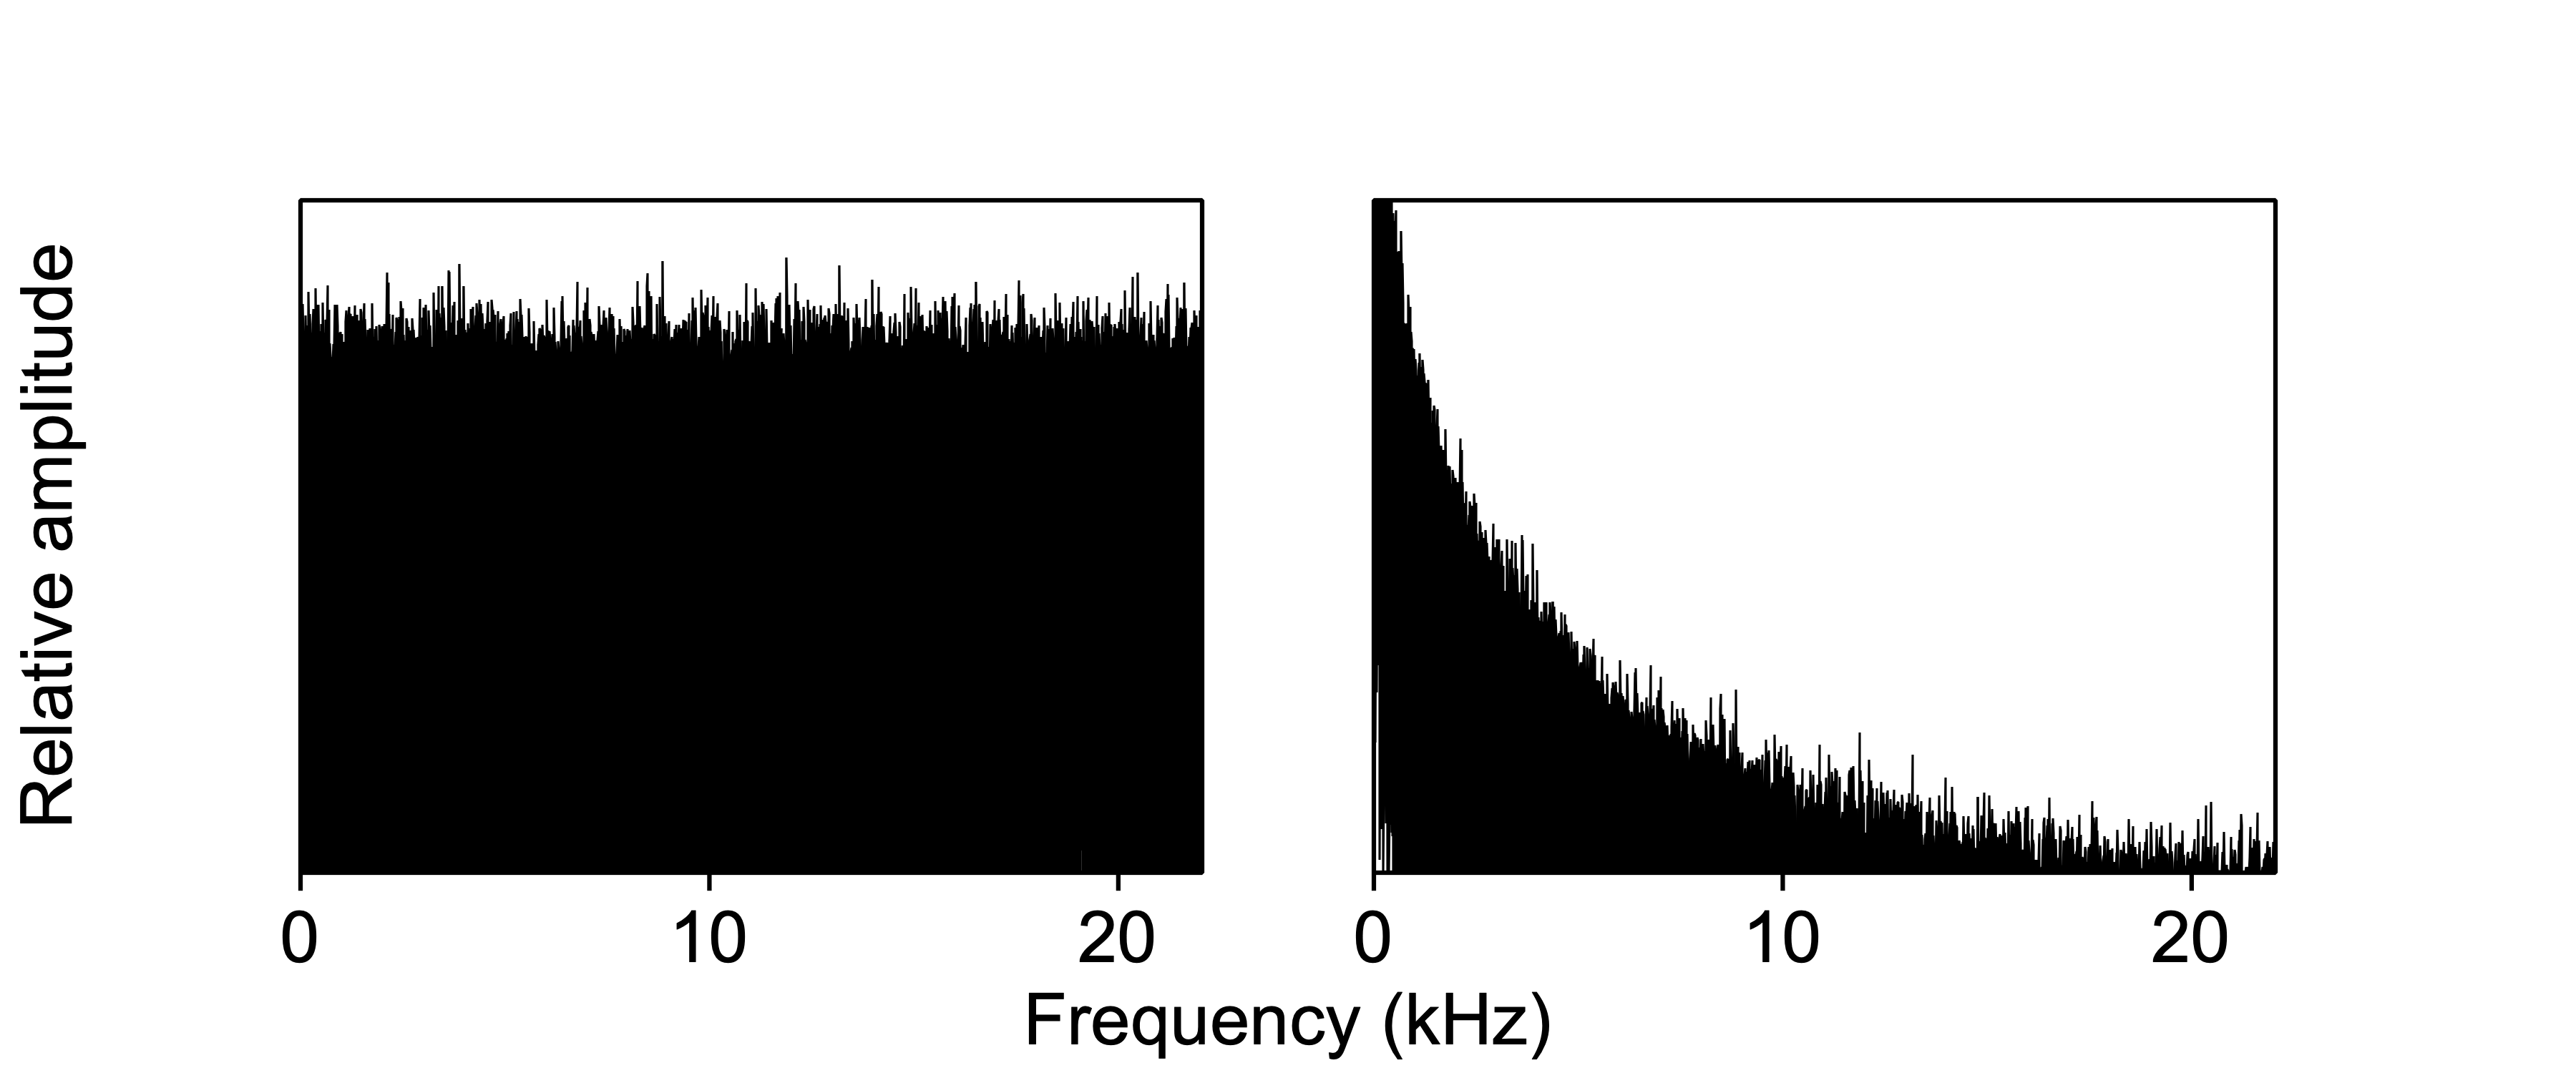
Figure 3.4: Spectra of white noise (left) and of brown noise (right), with a linear frequency axis (in kHz).
The random deviations from the ideal, smooth spectral envelope are due to (a) the random variability inherent in noise, and (b) the fact that the spectrum was calculated over a finite amount of time26, with (c) a particular sampling frequency of the noise.
3.3.2 Impulses
An impulse is a very brief and transient sound, such as a hand clap or tick. Acoustically, a very brief impulse sound is like a brief burst of white noise, with a flat spectral envelope. The shorter the impulse, the flatter the spectral envelope becomes.
An impulse may occur unintentionally if the amplitude suddenly increases from zero to a high value, e.g. at the onset of a sound recording starting at a nonzero value. The resulting noise burst should be effectively removed by fading in the sound, see §2.7.3 for more.
3.4 Envelope
The envelope of a sound describes how the properties of that sound change over time. This concept is best described by regarding the amplitude of a sound: the ‘amplitude envelope’. However, a sound may at the same time have multiple and different envelopes for its amplitude, for its (fundamental) frequency, and for (a singular parameter of) its timbre. Even the properties of a filter may follow an envelope, that is, they may change over time (see Ch. 4).
The concept of the envelope of a sound property stems from electronic music (synthesizers); critical time points are the onset and offset of a key being pressed on the keyboard of the synthesizer. However, the envelope is also a helpful concept for describing analog musical sounds (e.g. picking a guitar string) and speech sounds (e.g. plosive vs fricative consonants).
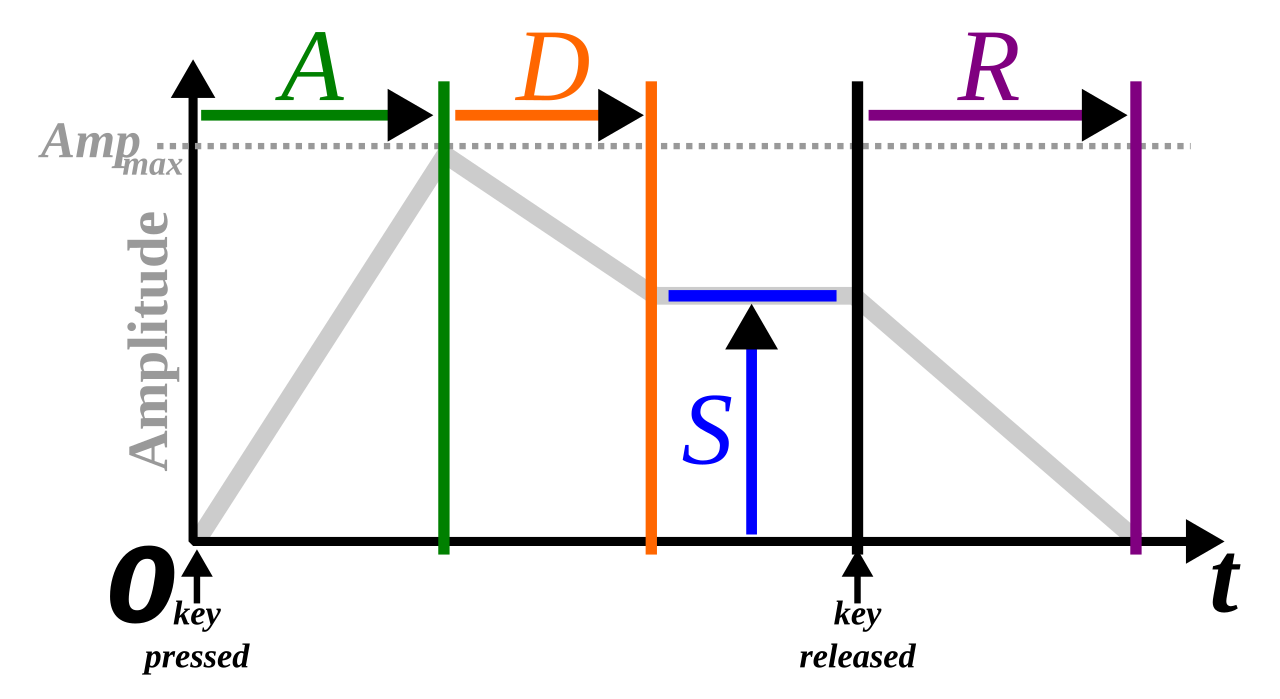
Figure 3.5: A typical amplitude envelope (in gray), with four key parameters Attack, Decay, Sustain, Release describing the changes of amplitude over time, relative to the onset and offset of a synthesizer keyboard key press. Image taken from \(https://commons.wikimedia.org/wiki/File:ADSR_parameter.svg\), used under CC-BY-SA license.
TODO: add text
A D S R
In terms of its amplitude, we may regard a brief impulse sound (click or pulse, see §3.3.2 above) as having very short attack and decay times, a zero sustain level, and zero release time.
Drawing the position of a swinging pendulum over time will result in the same figure.↩︎
Or, you might say that the period is infinitely long.↩︎
This is called ‘white’ noise by analogy with white light, in which all frequency components in the visible part of the electromagnetic spectrum are equally strong.↩︎
If you would listen to white noise for an infinitely long time, then all frequency components would indeed be equally strong.↩︎